SQL Server Health At a Glance
Real-time visibility into SQL Server health, backups, disk space, and performance metrics — all in one dashboard built for DBAs and IT teams.
Screenshots
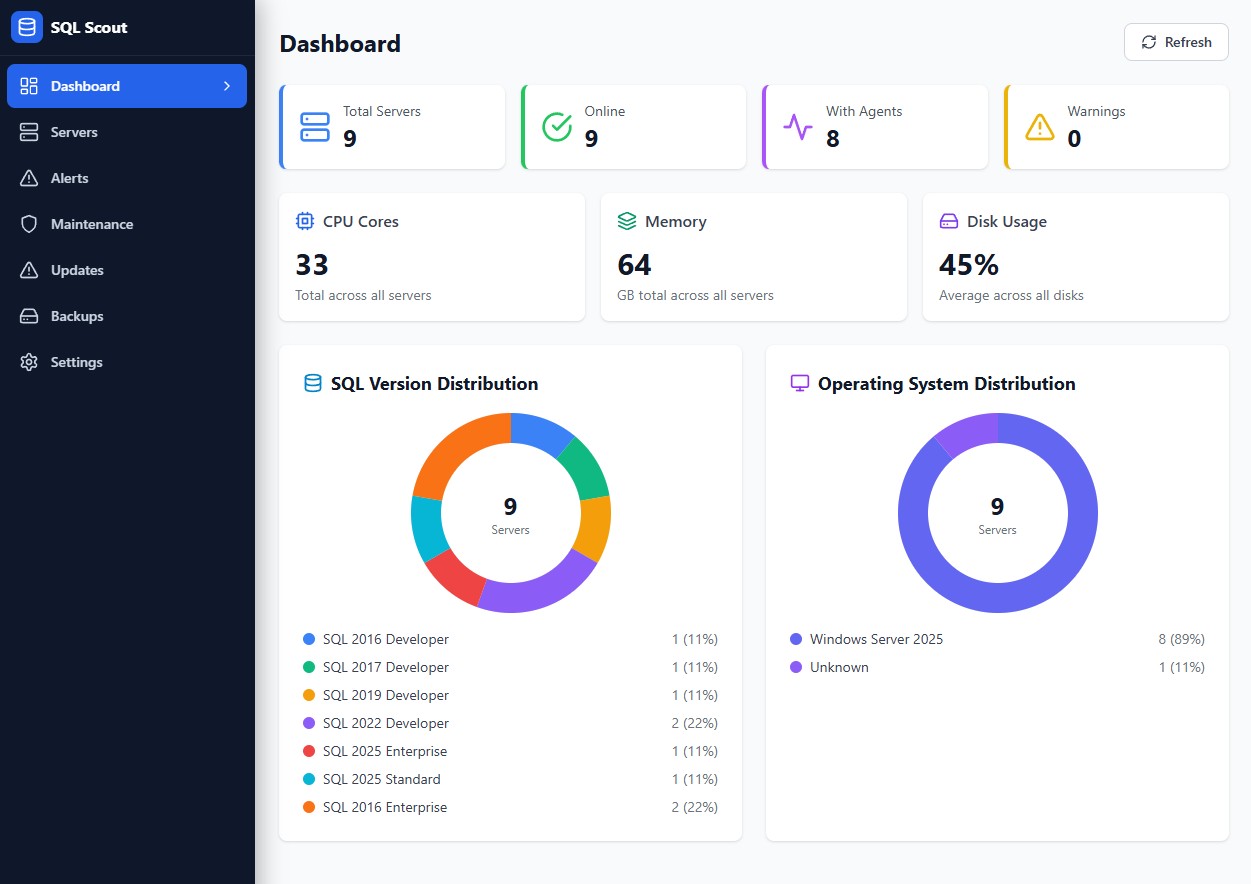
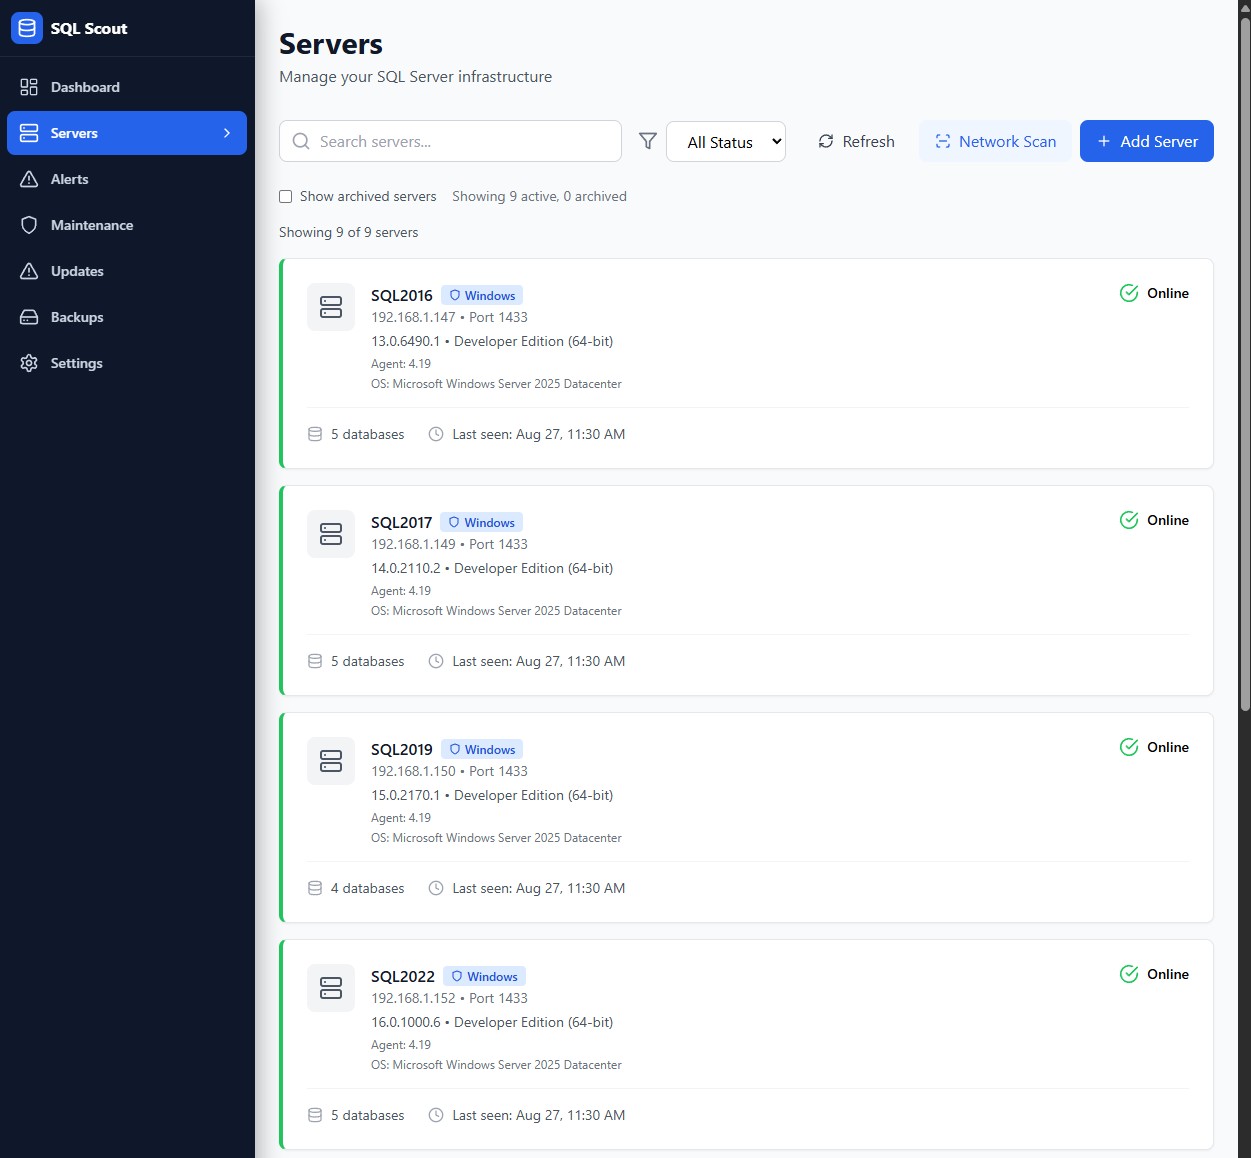
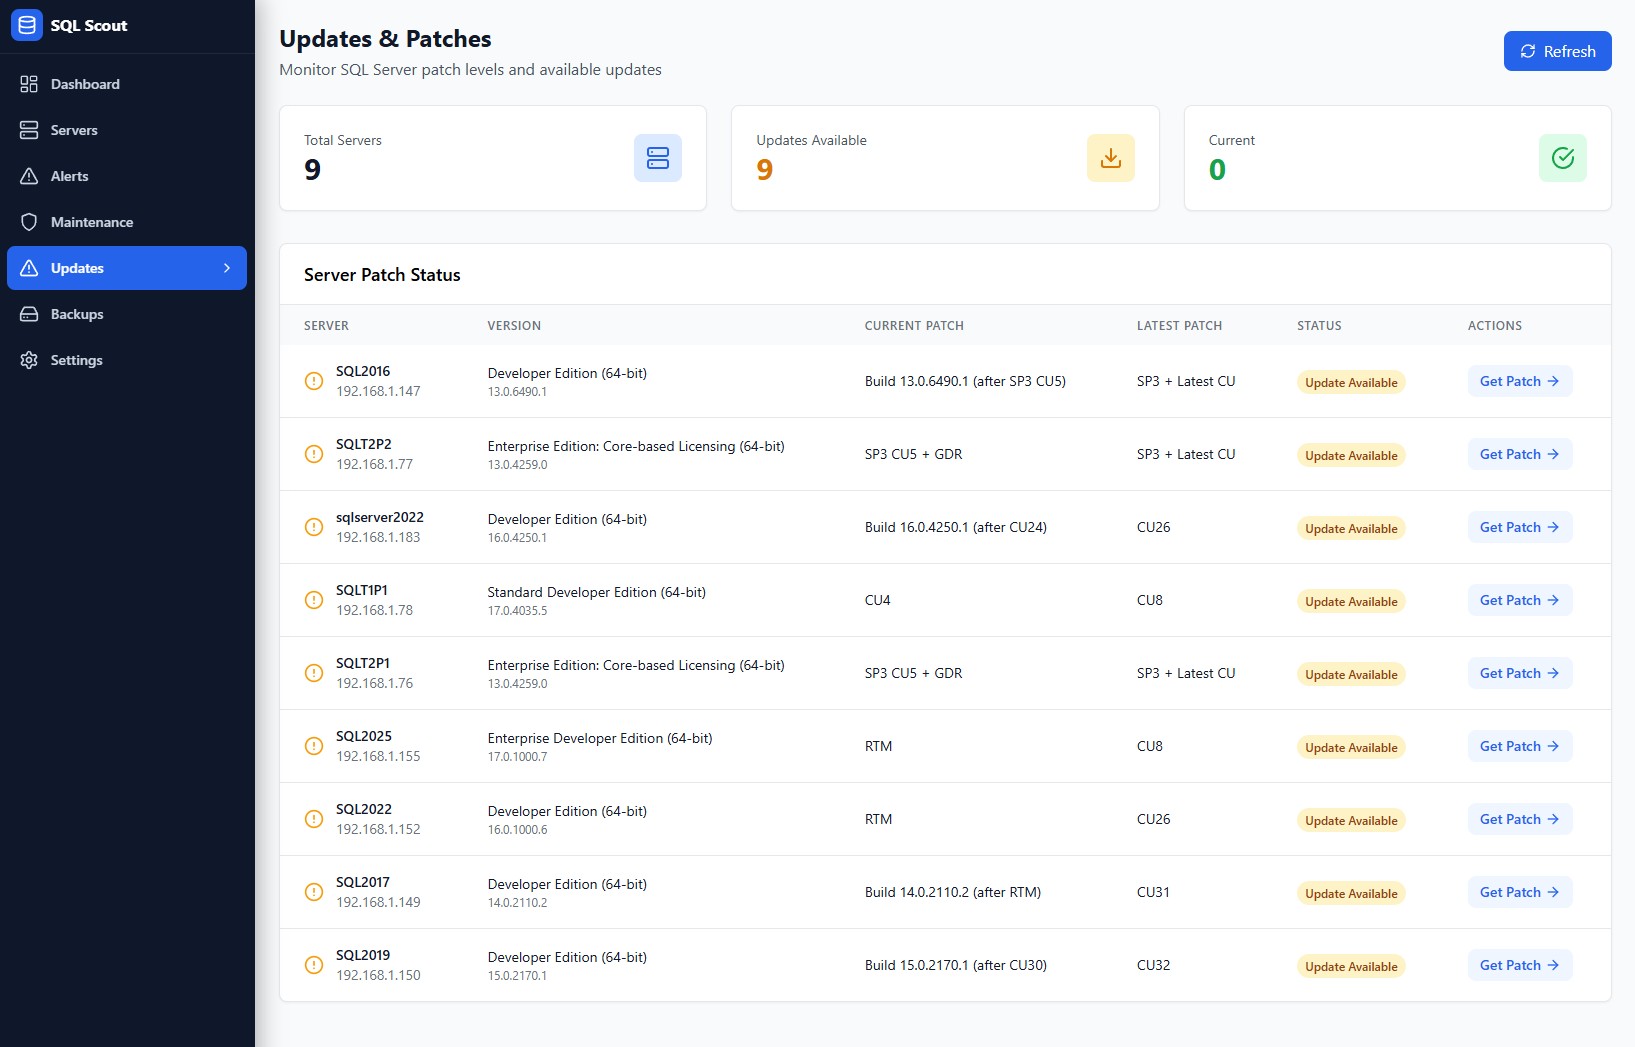
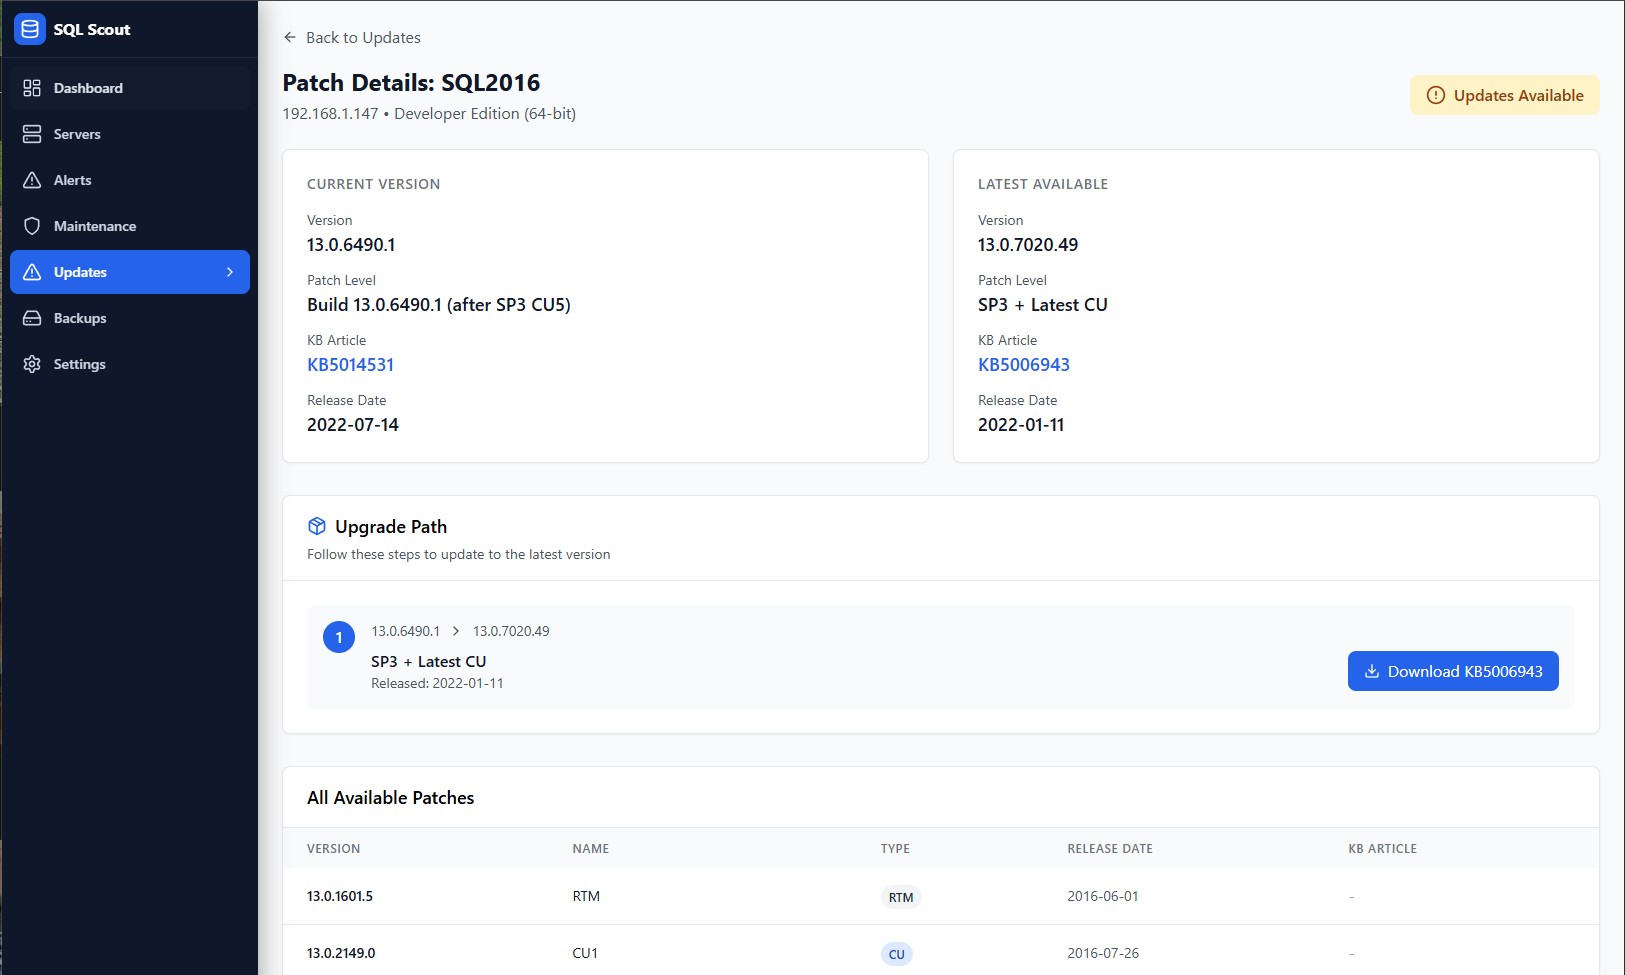
See It In Action
What You Get
Performance Metrics
CPU, memory, buffer cache hit ratio, batch requests/sec, and other key performance indicators updated in real-time.
Disk Space Monitoring
Track data files, log files, and tempdb usage across all instances with threshold alerts.
Backup Status
Full, differential, and log backup history powered by Ola Hallengren maintenance scripts, with age indicators and failure alerts.
Alerting & Anomalies
Automated detection of blocking processes, deadlocks, long-running queries, and resource pressure.
Instance Discovery
Auto-discover SQL Server instances on your network with detailed instance-level configuration.
Wait Statistics
Understand what your SQL Server is waiting on — PAGEIOLATCH, CXPACKET, LCK_M_X and more.
Want to see more?
Request a live demo and we will walk you through SQL Scout tailored to your environment.
Request a DemoBuilt with PowerShell agents, Node.js backend, and Next.js frontend